
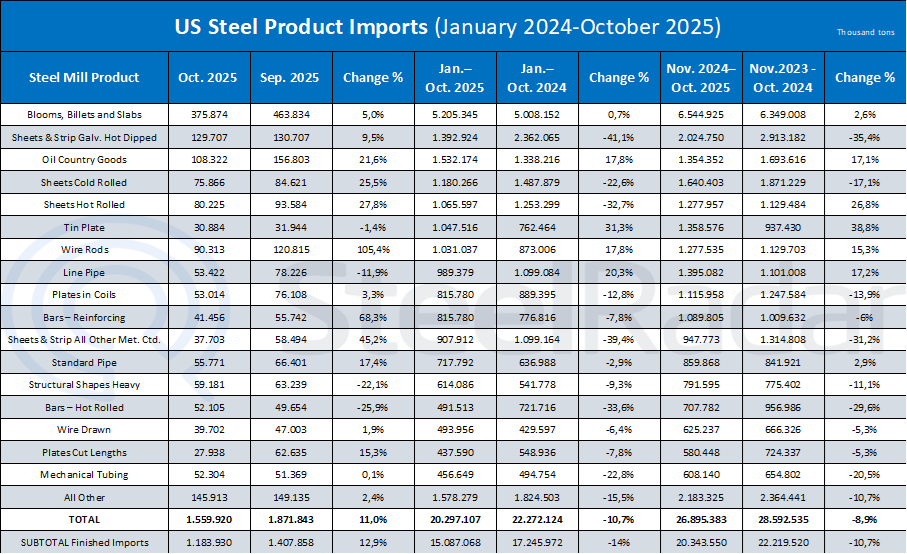
The American Iron and Steel Institute (AISI) reported, based on final data from the U.S. Census Bureau, that the United States imported a total of 1.73 million net tons of steel in October. Of this volume, 1.335 million NT consisted of finished steel products. Compared to September, the data indicate an 11% increase in total steel imports and a 12.9% rise in finished steel imports.
On a year-to-date basis, total steel imports continued to trend lower, declining by 10.7% compared to the same period in 2024. Finished steel imports over the same period fell by 14%. Looking at the 12-month period from November 2024 through October 2025, total steel imports decreased by 8.9%, while finished steel imports dropped by 10.7%. AISI noted that the finished steel import market share is estimated at 16% in October and 19% during the first ten months of the year.
On a monthly basis in October, the most notable increase was seen in wire rod imports, which surged by 105%. During the same month, rebar imports rose by 68%, other metallic-coated sheet and strip imports increased by 45%, hot-rolled sheet imports climbed by 28%, and OCTG imports advanced by 22%. On a year-over-year basis for the November 2024–October 2025 period, tin plate imports increased by 39%, pipe imports by 17%, OCTG imports by 17%, and wire rod imports by 15%.
In terms of supplier countries, Canada’s steel exports to the U.S. totaled 311,000 NT in October, unchanged from September. Brazil’s shipments rose sharply by 68% m-o-m to 294,000 NT, while imports from Mexico increased by 6% to 154,000 NT. In contrast, South Korea’s exports declined by 47% to 128,000 NT. Taiwan recorded a particularly strong increase, with shipments jumping by 139% to 96,000 NT.
Looking at the November 2024–October 2025 period, steel exports to the U.S. declined by 24% from Canada, 16% from Brazil, 9% from Mexico, and 4% from South Korea. Taiwan, however, stood out with a 27% y-o-y increase. Overall, these figures highlight a shift in regional supply dynamics in U.S. steel imports, with volumes from Canada, Brazil, and Mexico declining, while Taiwan has significantly expanded its market share.


Comments
No comment yet.