


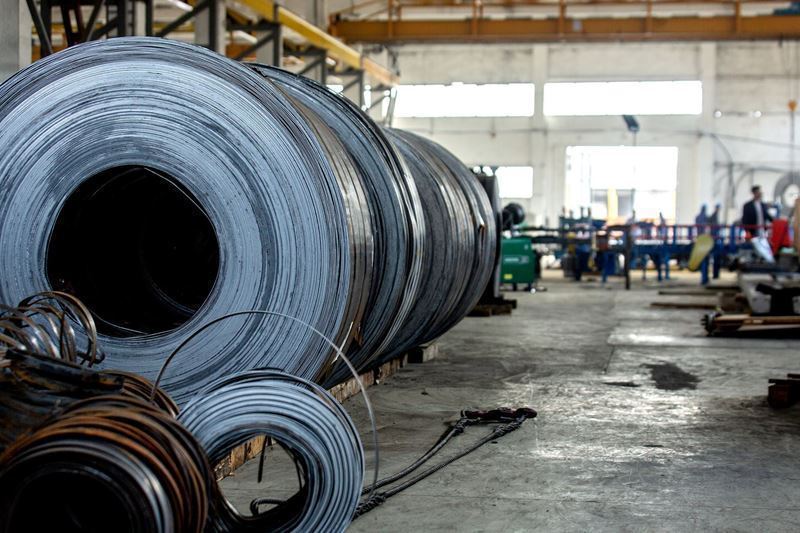
The American Iron and Steel Institute (AISI), citing data from the US Department of Commerce’s Steel Import Monitoring and Analysis (SIMA) system, reported that applications for steel import permits totaled 2.059 million net tons in June. Of this volume, 1.478 million net tons consisted of finished steel products. Total steel import permit applications in June increased by 3.5% compared to May permit applications but declined by 5.8% compared to May’s finalized import volume. Finished steel import permit applications were down 5.6% from the finalized May import figures.
During the first six months of 2026 (including June SIMA permit applications and finalized May import data), total steel imports fell by 23.1% year on year to 11.247 million net tons, while finished steel imports declined by 24.3% to 8.181 million net tons. AISI estimated that finished steel imports accounted for 17% of the US market in June and 16% during the first half of the year.
By product category, line pipe recorded the largest month-on-month increase in June, rising 94% compared with finalized May import data. Hot-rolled sheet followed with a 39% increase, cut-to-length plate with 31%, cold-rolled sheet with 20%, and structural pipe and tubing with 18%. In the first half of 2026, compared with the same period of 2025, imports of standard rails increased by 97%, heavy structural shapes by 58%, structural pipe and tubing by 12%, and rebar by 11%.
South Korea accounted for the largest volume of steel import permit applications in June at 405,000 net tons, followed by Canada with 298,000 net tons, Vietnam with 223,000 net tons, Mexico with 194,000 net tons, and Brazil with 133,000 net tons. Compared with finalized May data, permit applications from South Korea increased by 2%, Canada by 6%, Vietnam by 57%, and Mexico by 5%, while applications from Brazil declined by 60%.
In the first half of 2026, South Korea remained the largest steel supplier to the United States, with 1.978 million net tons, followed by Canada with 1.576 million net tons and Brazil with 1.393 million net tons. During the same period, imports from South Korea increased by 36% year on year, while imports from Canada and Brazil declined by 44% and 46%, respectively.








Comments
No comment yet.