
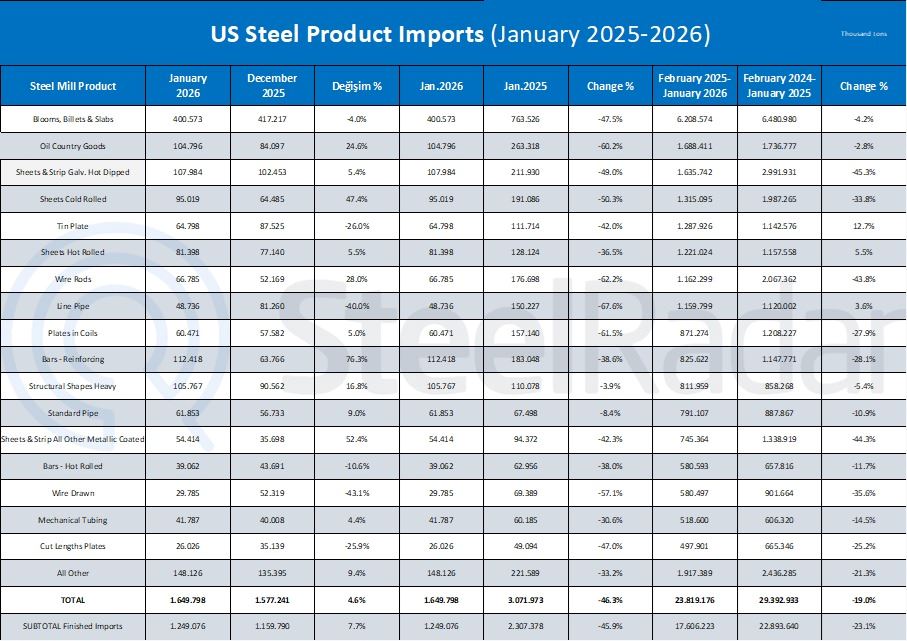
According to the final data of the American Iron and Steel Institute compiled by SteelRadar; U.S. steel imports totaled 1,650,000 net tons in January 2026. Of this volume, 1,249,000 net tons consisted of finished steel products. Compared to December 2025, total steel imports increased by 4.6%, while finished steel imports rose by 7.7%.
On a year-on-year basis, imports showed a significant decline. In January 2026, total steel imports decreased by 46.3% compared to January 2025, while finished steel imports fell by 45.9%.
During the 12-month period between February 2025 and January 2026, total steel imports declined by 19.0% compared to the previous 12-month period, while finished steel imports dropped by 23.1%.
In January, finished steel imports are estimated to have accounted for approximately 15% of the U.S. market.
Compared to December, steel products that recorded significant increases in imports in January included rebar (+76%), other metallic-coated sheets and strips (+52%), cold-rolled sheets (+47%), hot-rolled sheets (+28%), and oil country tubular goods (OCTG) (+25%).
For the 12-month period between February 2025 and January 2026, the main product group that recorded an increase in imports compared to the previous 12-month period was tin plate, with imports rising by 13%.
In January, the largest steel suppliers to the United States were South Korea, Mexico, Canada, Brazil, and Taiwan, respectively. Imports from South Korea increased by 71% compared to December, reaching 285,000 net tons. Imports from Mexico rose by 72% to 235,000 net tons, while imports from Canada declined by 7% to 218,000 net tons. Imports from Brazil fell by 31% to 177,000 net tons, whereas imports from Taiwan surged by 87% to 73,000 net tons.
On an annual basis, during the February 2025–January 2026 period, Canada remained the largest steel supplier to the United States. Imports from Canada fell by 38% compared to the previous 12-month period, totaling 4,094,000 net tons. Imports from Brazil declined by 20% to 3,717,000 net tons, while imports from South Korea decreased by 11% to 2,621,000 net tons. Imports from Mexico dropped by 28% to 2,586,000 net tons, while imports from Taiwan increased by 4%, reaching 1,081,000 net tons.


Comments
No comment yet.