
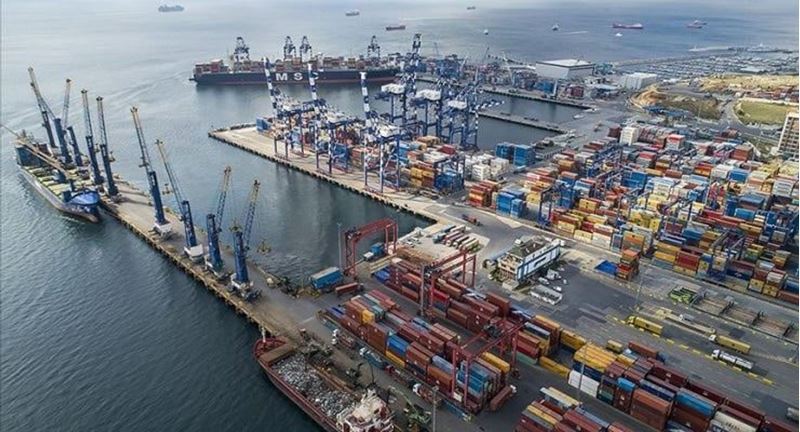
Türkiye’s foreign trade data for August 2025 have been announced by the Ministry of Trade. According to the announcement, exports decreased by 0.9% year-on-year to $21.795 billion, while imports fell by 3.9% to $25.963 billion. As a result, the foreign trade deficit declined by 16.7% to $4.197 billion.
In the January–August period, exports rose by 4.3% compared to the same period last year, reaching $178.112 billion, while imports increased by 5.6% to $238.183 billion. During the same period, the foreign trade volume grew by 5.1% to $416.295 billion.
In August, the ratio of exports to imports increased to 83.9%. Excluding energy data, this ratio rose to 97.1%, and when excluding both energy and gold, it reached 101.8%.
By country, Germany was Türkiye’s largest export market. Exports to Germany in August totaled $1.776 billion, followed by the U.S. with $1.276 billion and the U.K. with $1.155 billion. The top 10 countries accounted for 46.2% of total exports.
In imports, China ranked first with $3.903 billion, followed by Russia with $3.291 billion and Germany with $2.260 billion. The top 10 countries accounted for 59.4% of total imports.
By country groups, European Union (EU-27) countries led exports with $9.084 billion, followed by Near and Middle Eastern countries with $3.833 billion, and other European countries with $3.187 billion. In imports, EU-27 countries accounted for $8.148 billion, Asian countries $7.547 billion, and other European countries $4.984 billion.
According to the Broad Economic Categories (BEC) classification, the largest share in exports belonged to raw materials (intermediate goods) with $11.058 billion. This was followed by consumer goods with $7.225 billion and capital (investment) goods with $3.053 billion. In imports, raw materials (intermediate goods) led with $17.741 billion, followed by capital goods at $4.285 billion and consumer goods at $3.866 billion.
By sector, manufacturing accounted for the largest share of exports at 94.9%. In August, exports from the manufacturing sector totaled $20.681 billion, while agriculture, forestry, and fisheries contributed $598 million, and mining and quarrying $348 million. In imports, manufacturing also led with a 82.3% share, followed by mining and quarrying at 12.7% and agriculture, forestry, and fisheries at 2.5%.


Comments
No comment yet.