11,082.63 TRY BIST 100 BIST 100
48.46 EUR EUR EUR
41.72 USD USD USD
5.89 CNY CNY CNY
0.12 CNY CNY/EUR CNY/EUR
39.37 TRY Interest Interest
64.63 USD Fossil Oil Fossil Oil
63.19 USD Silver Silver
11,082.63 USD Copper Copper
104.84 USD Iron Ore Iron Ore
338.00 USD Shipbreaking Scrap Shipbreaking Scrap
5,167.38 TRY Gold (gr) Gold (gr)

The EU imported 14.6 billion euro worth of green energy products in 2024

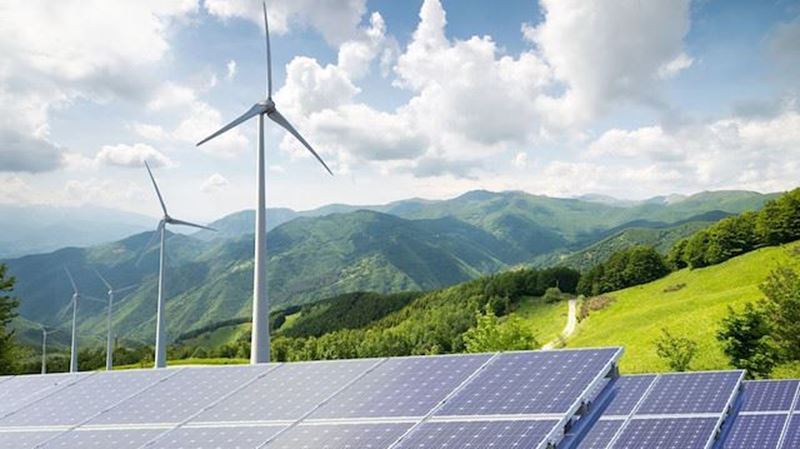
In 2024, the European Union (EU) imported a total of approximately 14.6 billion euro worth of green energy products from non-EU countries

The EU imported 14.6 billion euro worth of green energy products in 2024

Within this scope, the EU imported solar panels worth 11.1 billion euro , liquid biofuels worth 2.9 billion euro, and wind turbines worth 0.5 billion euro.

Decline in solar panel and biofuel imports

The value of solar panel imports fell by 43% compared to 2023 due to price decreases, although the total weight increased by 2%. Imports of liquid biofuels also recorded a 25% drop in value.

Rapid increase in wind turbine imports

Wind turbine imports grew sharply, with a 102% increase in value and a 113% increase in weight. In 2024, the EU imported a total of 32,373 wind turbines, 9,072 more than in 2023.

Wind turbines lead exports

In exports, the EU shipped solar panels worth 0.7 billion euro, liquid biofuels worth 1.8 billion euro, and wind turbines worth 2.8 billion euro in 2024. Wind turbine exports increased both in value (+41%) and weight (+28%), totaling 17,180 turbines, 7,434 more than in 2023.

Solar panel exports fell 22% in value but rose 24% in weight. Liquid biofuel exports declined both in value (-18%) and weight (-7%).

China and India as main suppliers

China remained the largest supplier of solar panels, accounting for 98% of total imports. While the share remained the same as in 2023, the import value decreased from 19.0 billion euro to 10.9 billion euro.

In liquid biofuel imports, China became the leading supplier with a 24% share, compared to 36% in 2023. Other major suppliers included Malaysia (15%), the United Kingdom (13%), and Brazil (12%).

In wind turbine imports, India and China led the market. Compared to 2023, China’s share rose from 31% to 43%, while India’s share declined from 58% to 48%.

Comments

No comment yet.

Only +plus subscribers can access this content.

SUBSCRIBE now to share your thoughts on the markets and get more comments.
SUBSCRIBE If you already have an account Sign In

Most read news

German Mechanical Engineering Industry Association: EU steel measures could undermine industrial competitiveness

Friday, October 10, 2025

CSN sued for BRL 430 million over unauthorized steel slag disposal

Friday, October 10, 2025

Türkiye’s imported scrap prices continue to rise

Friday, October 10, 2025

Strengthened period begins for origin controls under the Türkiye-Malaysia FTA

Friday, October 10, 2025
Follow List
Expand
Your watch list is empty

Add your favorite commodities for quick access and don't miss the latest price change news.


There are no news categories you follow
Edit Notification Preferences
E-bulletin subscription
Sign up to receive the latest news and daily iron prices by e-mail and sms
Become a Plus Subscriber Now!
Try it free for 3 days!
Subscribe Now
Neutral Prices
Be informed
Provincial Iron Prices
Comments and Analysis
Subscribe Now